I am providing here information about two different variations of getting your baseline readings before you start your investigation, both are legitimate ways to obtain your readings, however, the first “Positional Baseline” could be considered the more “scientific” approach of the two.
 Positional baseline
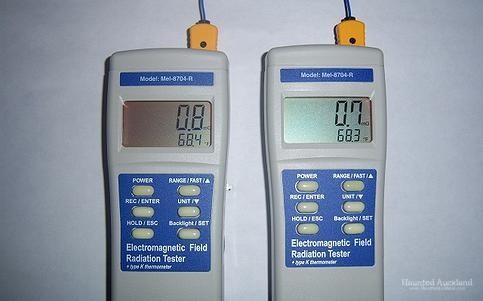
This is a baseline reading to set a standard for your investigation. You need two measuring instruments that measure the same parameters (e.g Magnetism, temperature) and have similar specifications, have two devices of the same model and type, for example, two Mel Meters “Mel8704r’s” that have been properly calibrated.
You place one of the Mel8704r’s at the “location of the haunting” (e.g. the room where the haunting occurred) and you place the other one in a location nearby which we call the control location. The two locations need to be as similar as possible in temperature, lighting etc., The control location must be a place where there has been no reports of paranormal phenomena
We can expect that the readings would be similar, or the same, the length of the investigation. Differences that are noted may indicate a variable related directly to the paranormal phenomena, that may not have been accounted for previously.
This kind of baseline reading allows us to compare the “control location” with the “location of the haunting” which allows us to see any differences in readings (e.g. magnetism, temperatures) which may be related directly to the source of the “paranormal phenomena”. It may also allow us an insight into a natural explanation that hasn’t yet been perceived
You would expect readings to be similar over the course of the vigil. Any major differences, particularly when something is reported, could be significant. They may indicate a variable related to the reported paranormal event.
Grid Method
 This works best if the location owner will allow you to mark out a grid on the location floor, but, as this is highly unlikely, it is easier to have some graph paper and draw a map, allocating a certain amount of graph squares per each meter, thus creating the grid-squares.
On your map remember to mark all walls, windows, doors, objects (cupboards, fridges etc.)
Now as one investigator begins to measure each sectioned grid for EMF the other notes the reading in each individual grid section. (A slight variation is to allocate each grid a number or letter, then have the letters written on another page, and write the reading next to the corresponding letter).
If there are odd readings, or “spikes” during this phase, investigate possible causes.
Do this once with the power on.
Then once with the power off (if allowable)
Now take measurements near all electrical power-points, light fittings and electrical devices, remember fridge and freezers have motors that turn on and off and will give out differing readings during the evening, note if the fridge/freezer’s motor is on or off during your measurement times.
You can now repeat measurements at intervals during the investigation and compare reading levels in your audit.

